Lineage graph
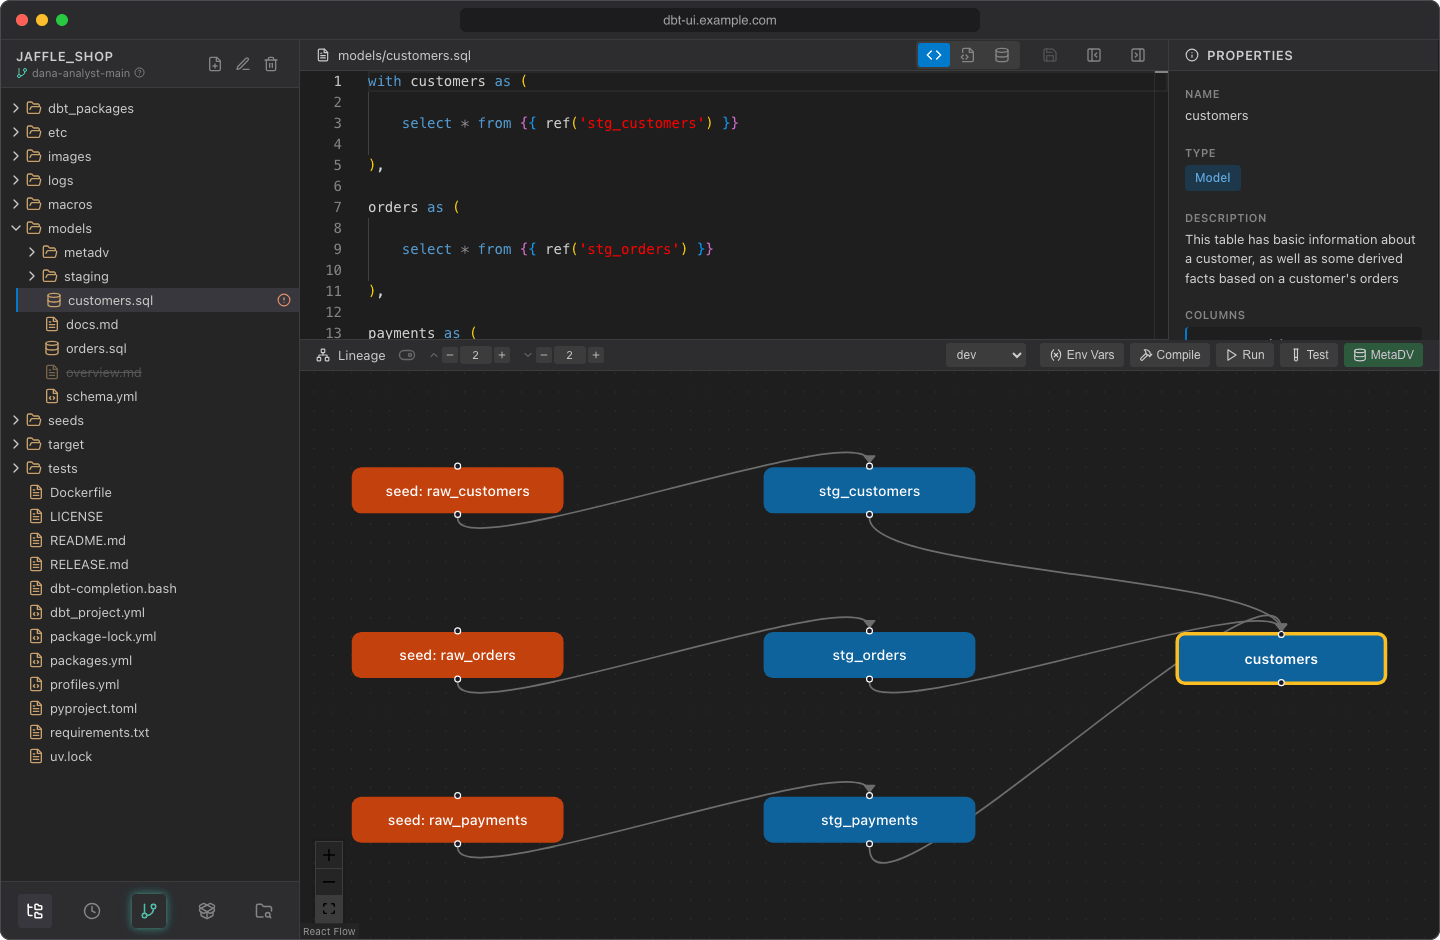
The lineage panel below the editor draws your models, seeds and sources as a graph, so you can see what a model depends on and what depends on it. Its header also holds the buttons to run dbt.
Turn it on
The graph is off when you open a project. Click the toggle next to Lineage ("Enable lineage") to show it. It stays on until you reload the page.
The graph is built from the project's manifest.json. If there's none yet, the panel shows "Compile dbt models to generate lineage data.": select a model and click Compile, leaving the selector empty to compile the whole project (see Running dbt). The graph reloads after each compile.
Read the graph
Arrows point from a node to the nodes that use it: upstream nodes are on the left, downstream nodes on the right.
| Node | Color | Label |
|---|---|---|
| Model | Blue | model name |
| Source | Green | source: <source>_<table> |
| Seed | Orange | seed: <seed name> |
The node of the selected file has a yellow border. Tests, macros and other resources aren't shown.
Navigate
- Focus on a model. Select a model or seed file in the project browser, or click a model or seed node. The graph shows that node with its upstream and downstream neighbors and centers on it.
- Open a file. Clicking a node opens its file in the editor. A source node opens the YAML file that defines it; since that file isn't a node itself, the graph then switches to the overview.
- Overview. When the selected file isn't in the graph (for example a macro, or nothing is selected), the graph shows all models, seeds and sources and fits them into the panel.
- Pan and zoom with the mouse (drag the background, scroll to zoom) or with the zoom and fit buttons in the corner. Nodes can't be dragged.
Depth
When the graph is on, two depth controls appear next to the toggle:
- Upstream depth (arrow up): how many levels of parents to show
- Downstream depth (arrow down): how many levels of children to show
Both default to 2 and range from 1 to 10. Use the − and + buttons or type a number.
Node limit
To keep the browser responsive, the graph shows at most 200 nodes. When there are more:
- With a node in focus, the graph falls back to the node and its direct parents and children, and shows "Graph has N nodes (limit: 200). Reduce upstream/downstream depth values."
- In the overview, it shows the first 200 nodes.
Administrators can change the limit with DBT_UI__FRONTEND_LINEAGE_MAX_NODES. It's applied when the frontend image is built, so rebuild after changing it (see the configuration reference).
Quick actions
The right side of the panel header has the actions for the selected file:
| Control | Use |
|---|---|
| Target dropdown ("Select dbt target") | The profiles.yml target the commands run against |
| Env Vars | Set env var values |
| Compile | Compile the selected model |
| Run | Run the selected model, or seed the selected seed |
| Test | Test the selected model |
| MetaDV | Open MetaDV (only when the feature is on) |
The actions follow your selection, so clicking a node and then Run runs that node's model. See Running dbt for how commands run.